As a leading provider of political data, Data Trust is dedicated to supplying pivotal data that drives transformative insights, enabling our clients to shift the outcome of elections. Our recent enhancements creating a regionality ‘MetroType’ field enable precise targeting and provide invaluable understandings into the dynamic political terrain. Data Trust’s commitment to innovation extends beyond individual data products; all our data seamlessly integrates, allowing for comprehensive analysis and uncovering powerful insights that go beyond surface observations.
Join us as we explore the evolving dynamics for election performances across various ‘MetroType’ groupings, leveraging our enhanced data capabilities to provide unparalleled understanding and strategic advantage in the political arena.
For this analysis, we looked at seven critical states: AZ, GA, NC, NV, OH, PA, and WI.
Key Takeaways
- Major cities and urban areas have experienced a decrease in contributions to the overall vote statewide, while rural and suburban areas are increasing their total contributions.
- Since 2012, vote contribution levels for the Urban ‘MetroType’ in the seven states decreased by 2 percentage points on average, while the vote contribution levels for the Rural and Suburban ‘MetroType’ in the seven states increased by 2 percentage points on average.
- Comparing the 2012 and 2020 Presidential elections, Republican election performance increased by an average of 5 percentage points in the Rural and Town ‘MetroType’ fields.
- The states with the largest increases were OH (11.8%), WI (7.0%), and PA (6.6%).
- The Rural and Town ‘MetroType’ in these states account for 35%, 47%, and 29% of the total vote, respectively.
- Even looking at the Urban ‘MetroType’ groupings, PA (3.6%), OH (3.5%), NV (1.3%), and WI (0.1%) saw the Republican increase their election performance in these traditionally less supportive regions.
- The states with the largest increases were OH (11.8%), WI (7.0%), and PA (6.6%).
Read on for more details.
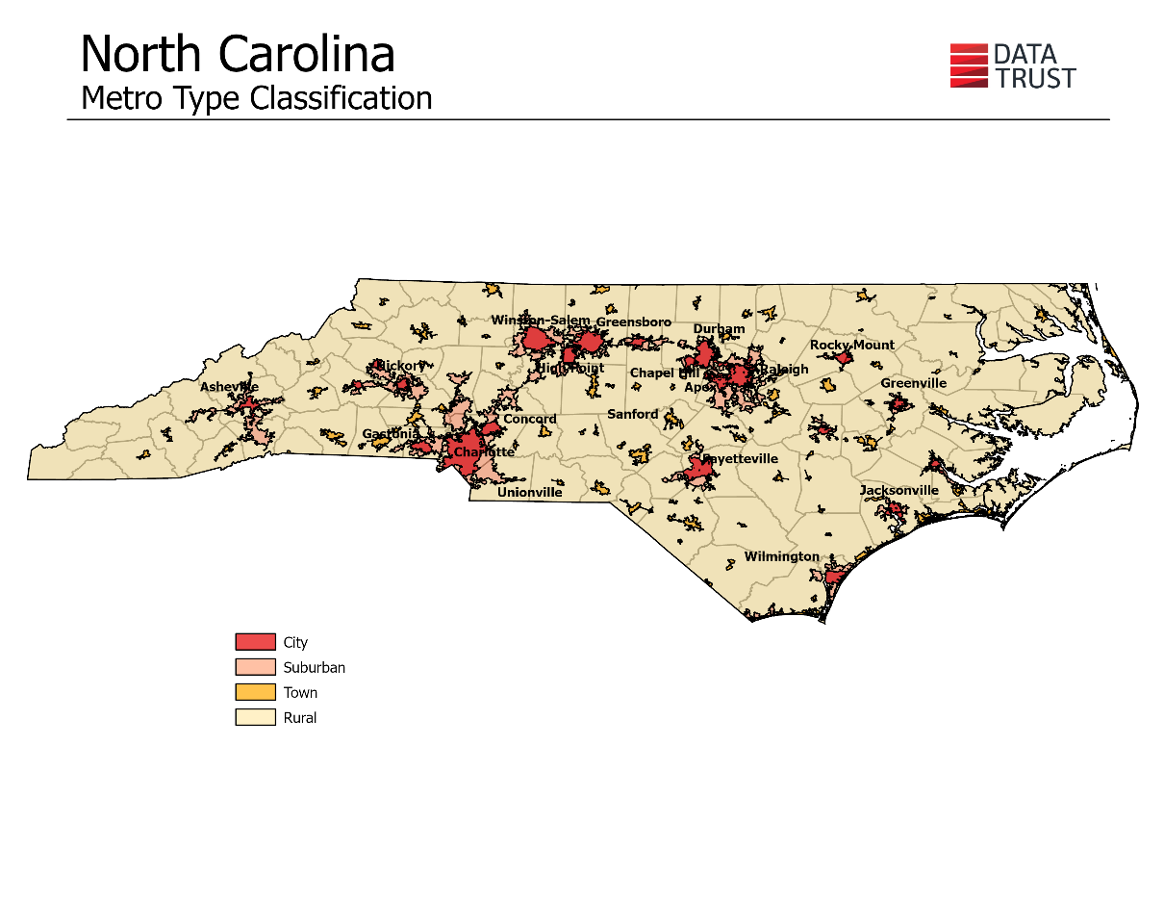
In this analysis, we utilized several of our data products to generate the tables presented below for North Carolina, beginning with our updated ‘MetroType’ field. Given that our ‘MetroType’ field deviates from conventional election geography, we employed our extensive historical dataset of disaggregated election data to examine historical election performance and vote contribution trends. The map above delineates the distinct ‘MetroType’ fields across North Carolina.

To evaluate historical election performances, we examined top-of-the-ticket races for each election dating back to 2012 (excluding the year 2018, which had no statewide election in NC). The left chart above illustrates Republican election performance, while the right chart depicts vote contribution share by ‘MetroType’. Each row is shaded to indicate the highest (green) and lowest (brown) values across the years. The final column shows the difference between the 2020 and 2012 Presidential elections.
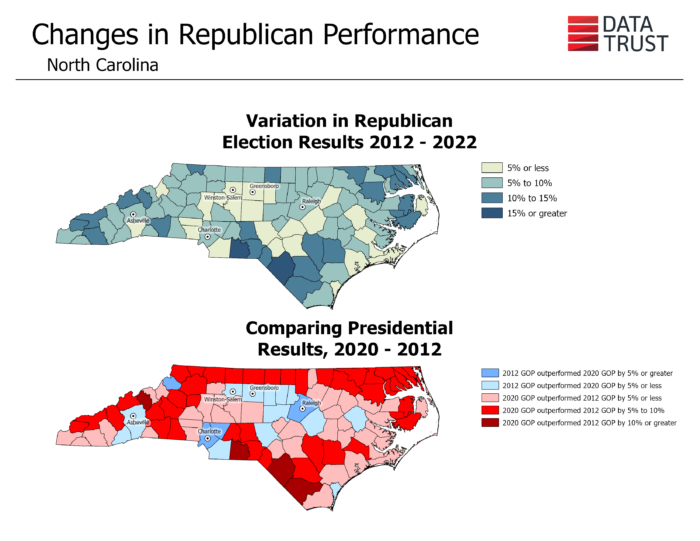
The maps above illustrate the changes in Republican performance from 2012 to 2022 and compare shifts in Republican Presidential election performance between 2020 and 2012. While this data aligns with trends observed in other critical states, North Carolina’s election shifts present distinctive features:
- Increases in Republican election performance in the Rural and Town ‘MetroType’ fields are not as substantial as in some other critical states.
- Declines in Republican election performance in the Suburban ‘MetroType’ field surpass those in similar states like WI (-3.1%), PA (-1.9%), and OH (+0.4%).
- Notably, North Carolina exhibits the largest increase (+2.3%) in the total contribution share of the vote from the Suburban ‘MetroType’ field to the overall vote.

The maps above showcase the same data but focus on a specific county. Brunswick County was selected due to its significant influx of out-of-state movers, accounting for 5% of new movers to North Carolina while representing only 1.8% of registered voters. In Brunswick County, areas with the most pronounced variance in election performances witnessed heightened Republican support. Conversely, regions with minimal variance experienced marginal improvements or declines, though less pronounced than those with increased Republican performance.
Data Trust stands as the foremost political data provider in the right-of-center ecosystem, delivering pivotal data that yields transformative insights capable of shifting elections. Our suite of data products seamlessly interacts, empowering clients to derive powerful election insights, as demonstrated above. To discover how Data Trust can cater to your needs, please contact us to explore our comprehensive range of data products and services.