Electoral Votes: 19
Important Dates
These dates are subject to change, please confer with your local electoral authority as Election Day approaches.
Registration Deadlines
- Mail / Online: 10/21/24
- In person: 10/21/24
Ballots Mailed
- 09/16/24
Ballot Request Deadline
- 10/29/24
Early Vote Date Range
- 9/16/24 – 10/29/24
Top Lines
Election performance shift for Trump, 2020 vs 2016
- From 2016 to 2020, President Trump increased his vote totals across all counties, achieving the highest gains in Pennsylvania’s major cities, Philadelphia and Pittsburgh, and received the most votes of any Republican in Pennsylvania’s history, a 26% increase since 2012.
- For the upcoming 2024 presidential election, the Republican deficit of absentee requests compared to Democrats is currently 35% smaller than at this time in 2020.

Turn Out
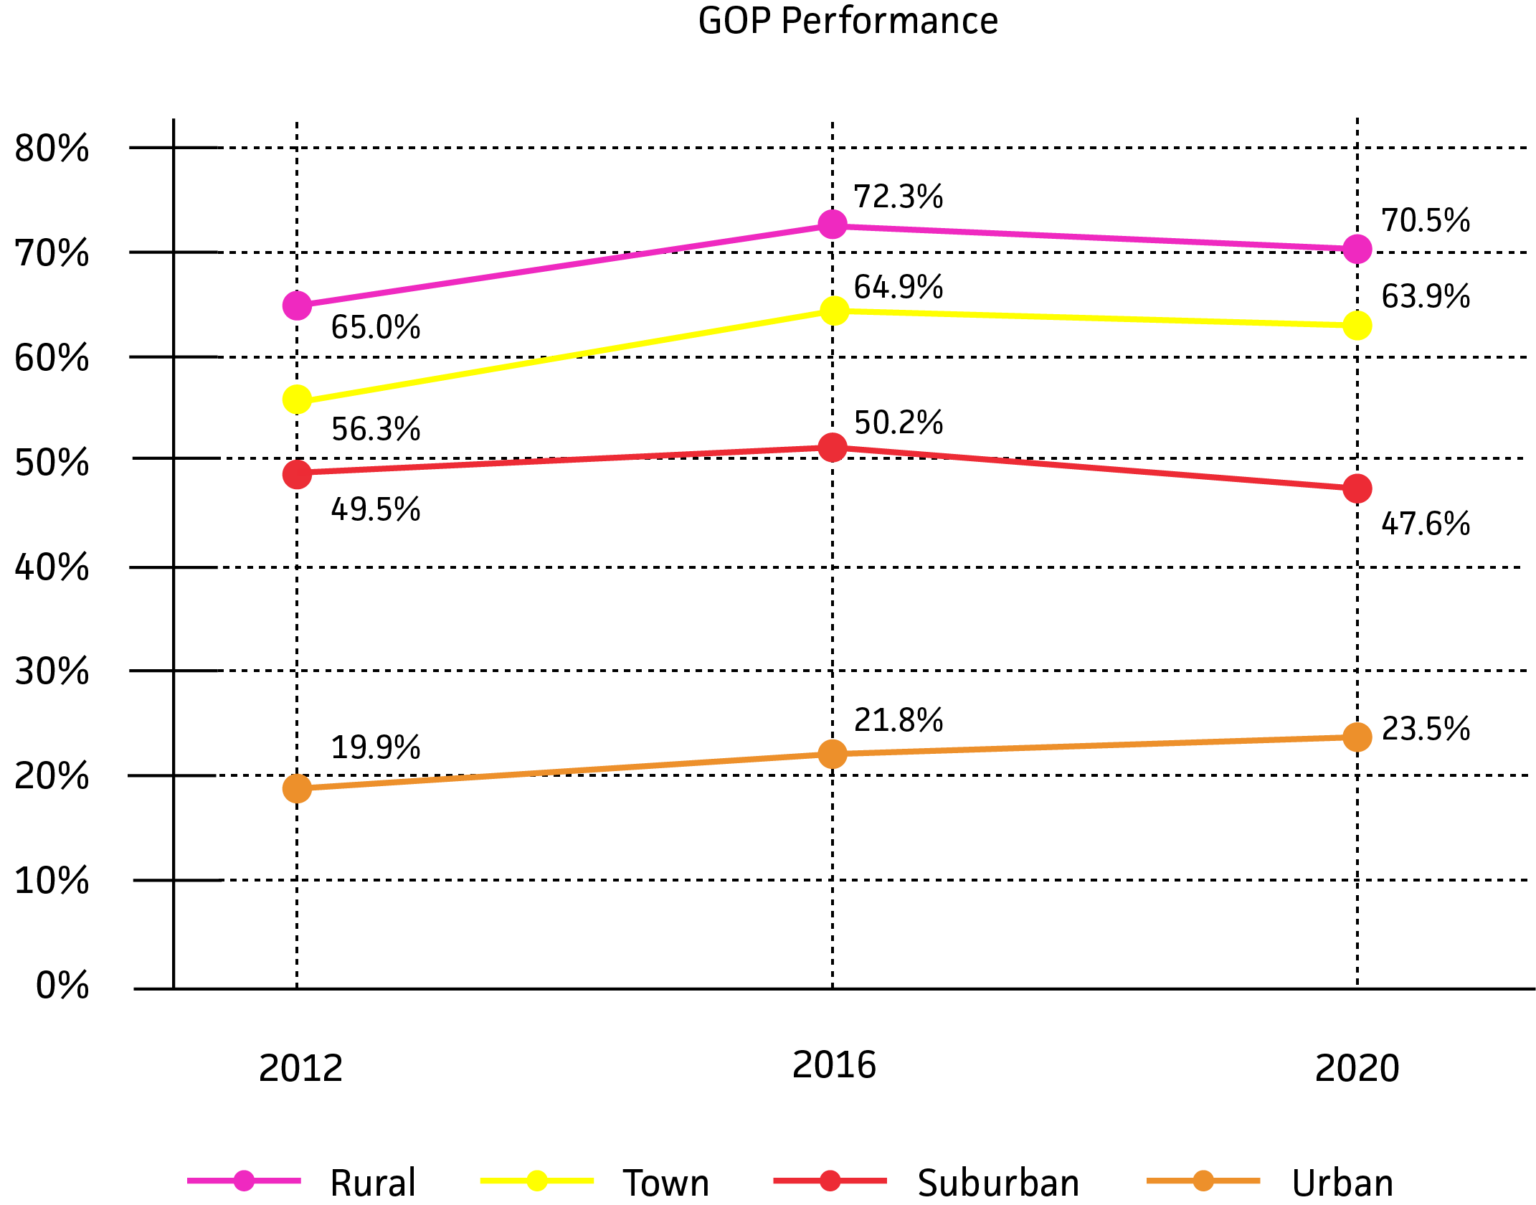
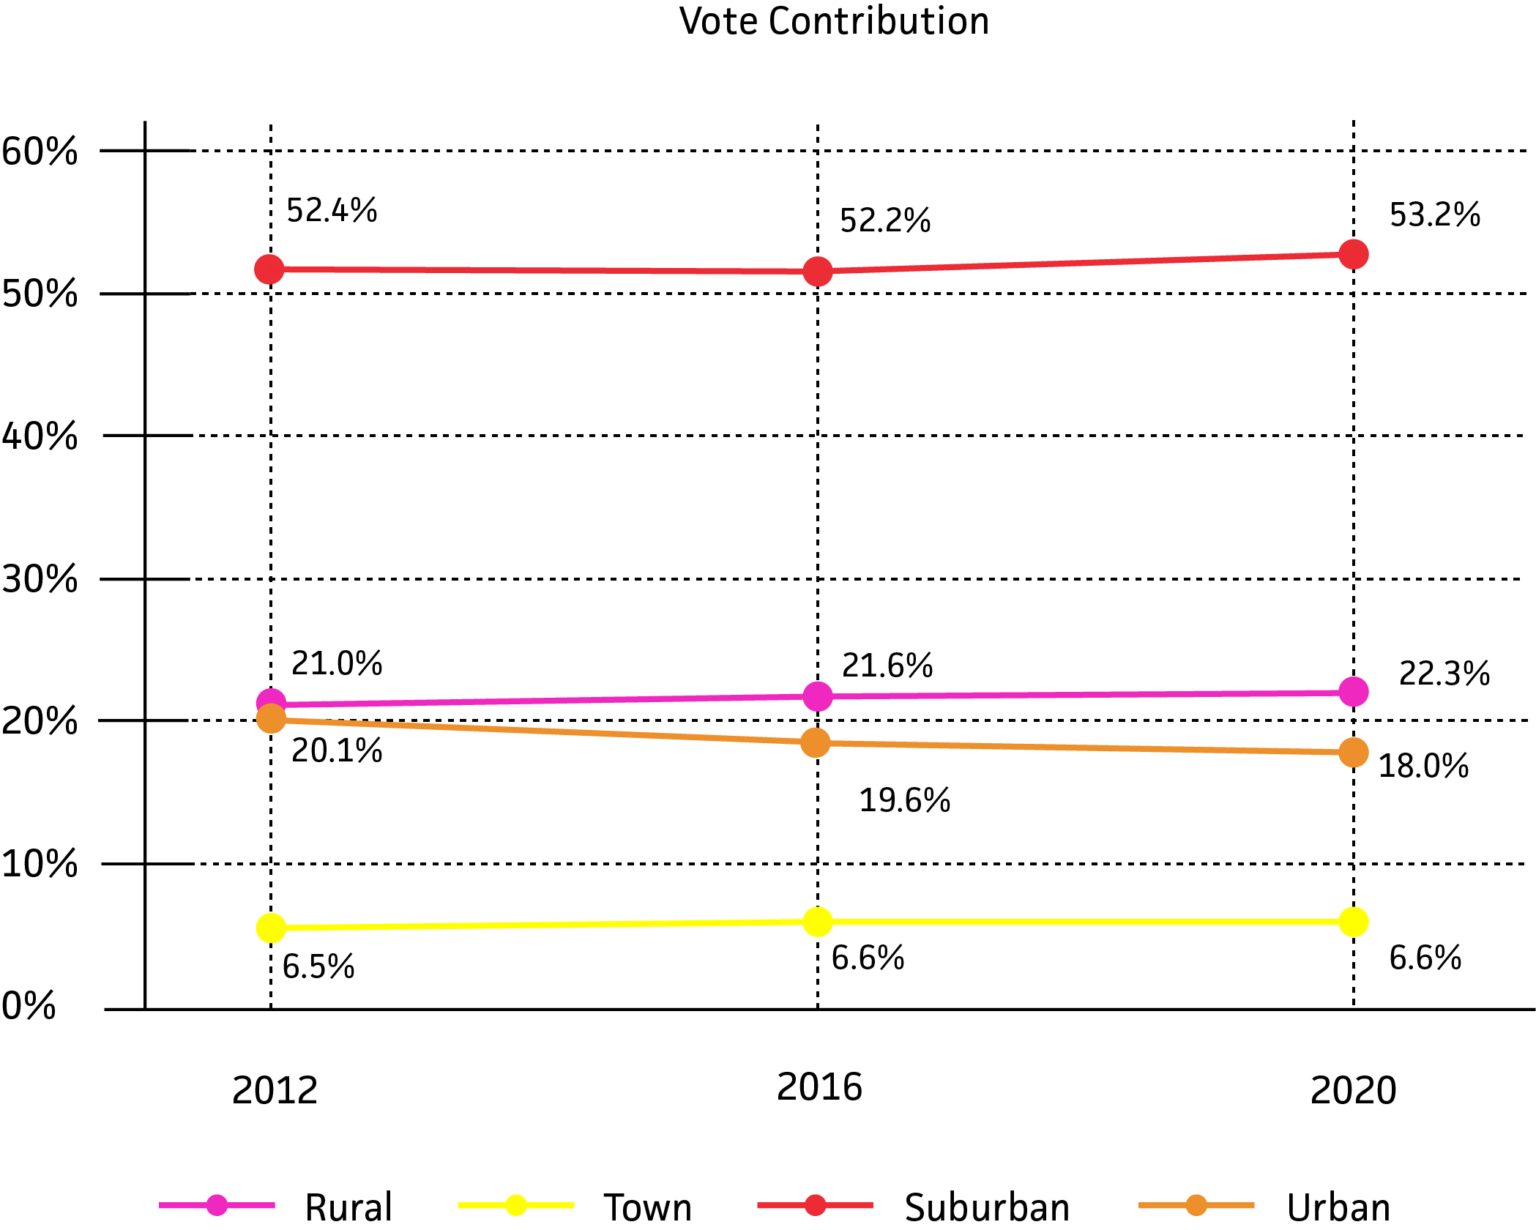
Understanding election results by population density is crucial because it reveals voting patterns and strategic areas for engagement. Here’s a breakdown of Republican election performances and total vote contributions by population density since 2012:
- Towns, Rural, and Urban areas have all seen an increase in Republican performances since 2012.
- Suburban areas remain the dominant regions, continuing to grow over the years, where Republicans had a slight turnout advantage in 2016.
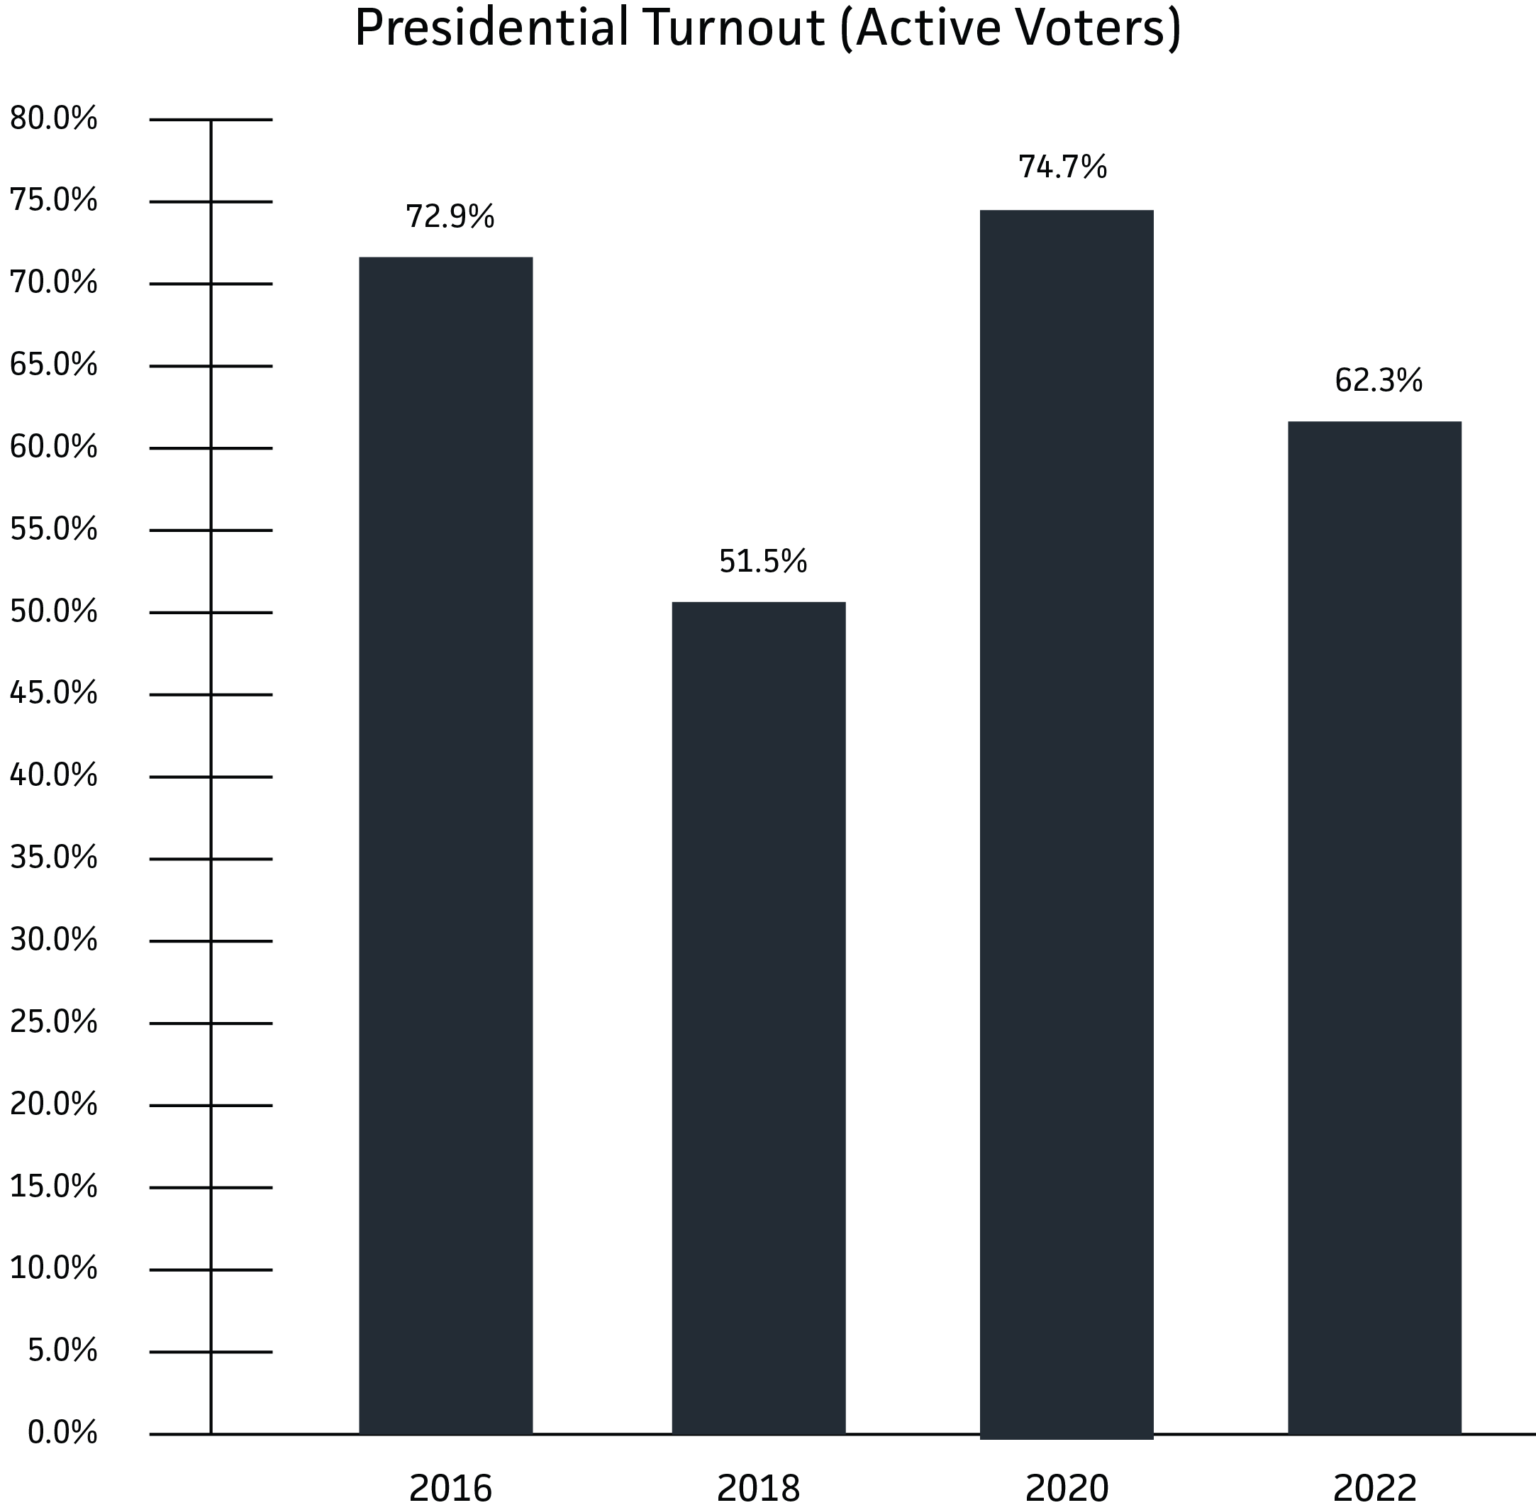
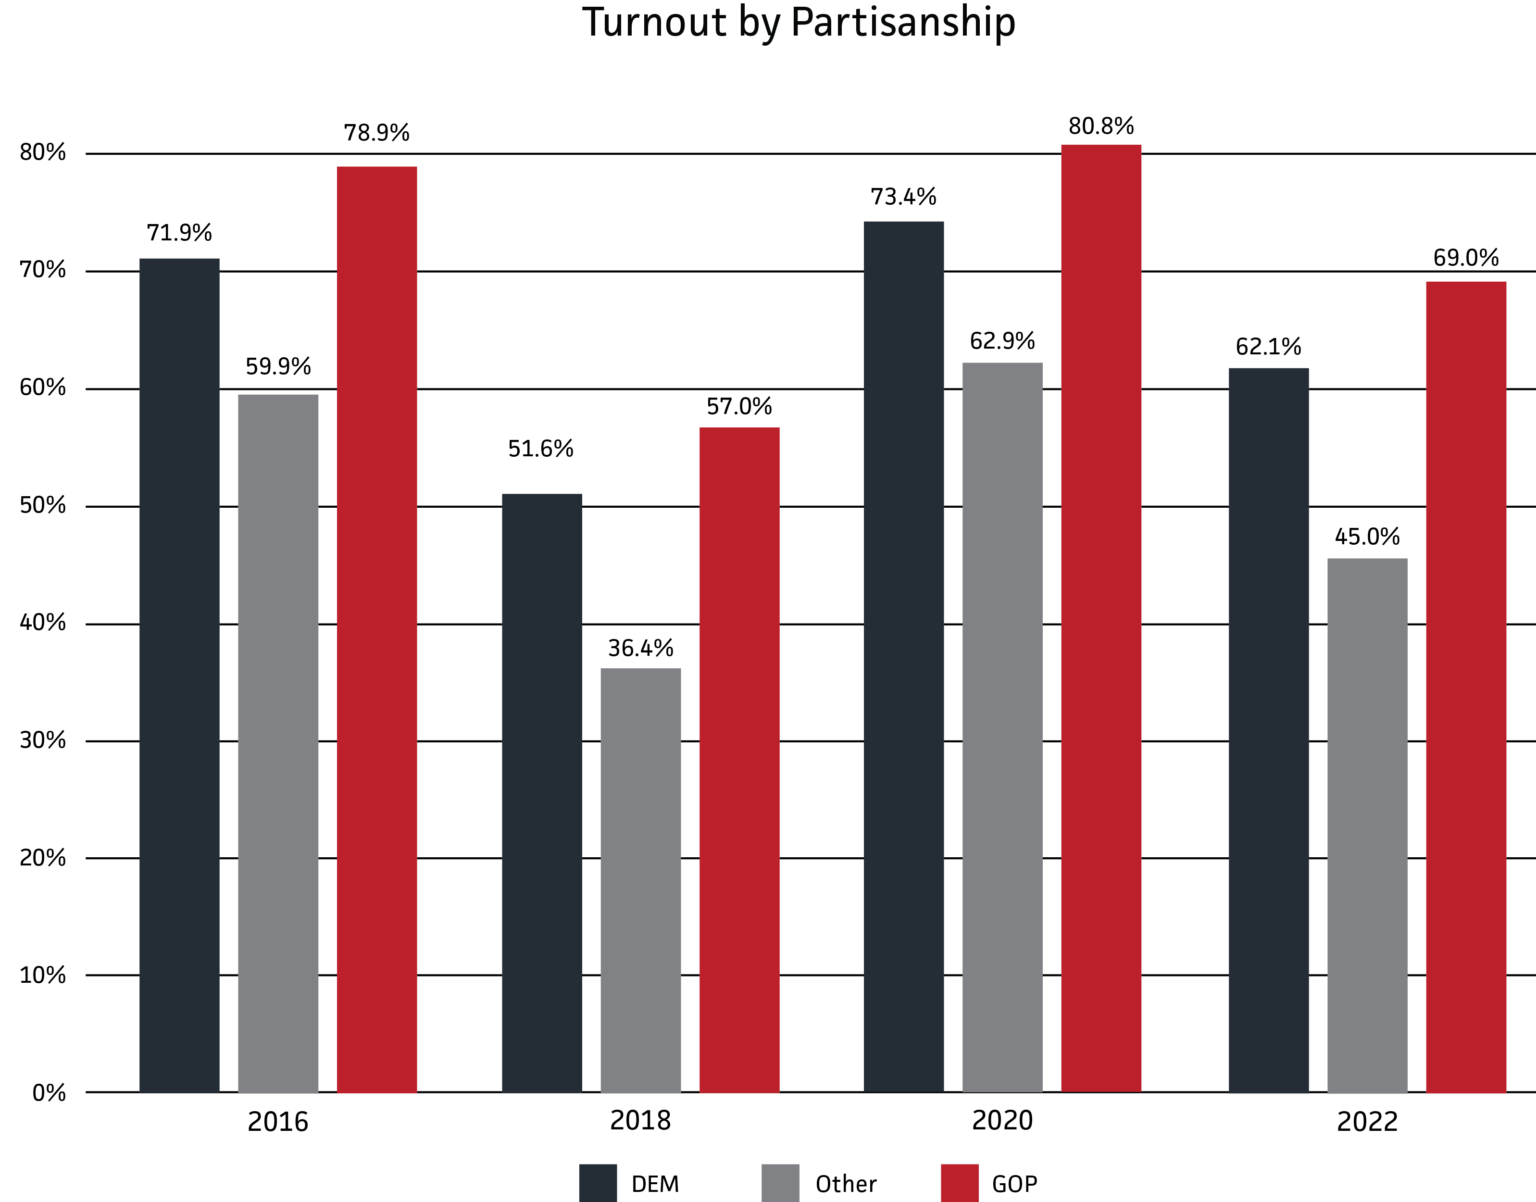
The charts below illustrate trends in voter turnout for elections between 2016 and 2022, as well as the differences in turnout among political parties during the same period.
- Active voters have been showing a positive trend in turnout increasing in both the most recent Presidential (+1.8%) and off-cycle (+10.8%) elections.
- Partisan turnout shows Republican voters followed this trend, increasing by 1.9% and 12% for Presidential and off-cycle elections, respectively.
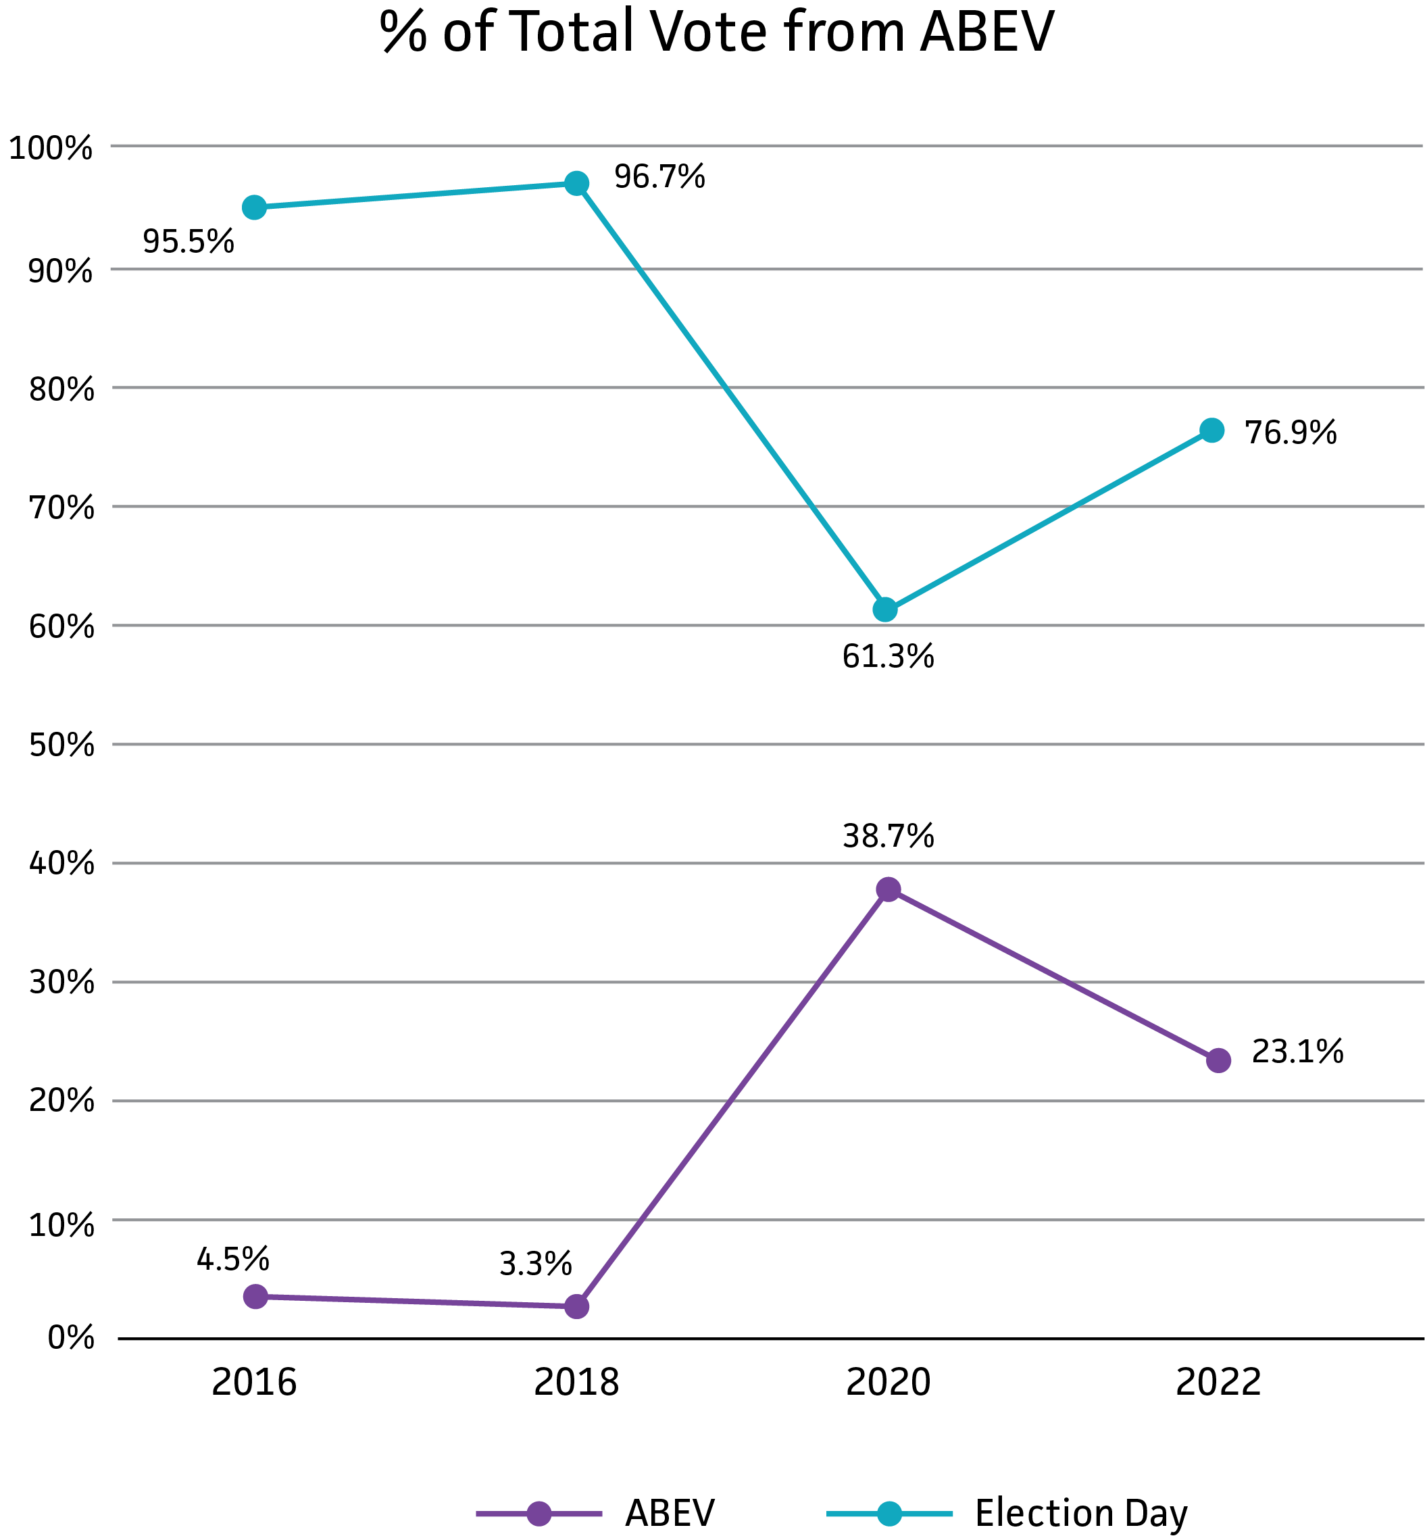
AB/EV
Data Trust collects the AB/EV file from the Pennsylvania Department of State daily, allowing for immediate insights and targeting of individual voters.
- Data Trust has already begun collecting AB/EV files in Pennsylvania, collecting 22 files so far.
- Compared to this point in time in 2020, Republicans have requested 76% of their ballots while Democrats have only requested 69% of their ballots from 2020.