Electoral Votes: 16
Important Dates
These dates are subject to change, please confer with your local electoral authority as Election Day approaches.
Registration Deadlines
- Online/In Person: 10/11/24
- Mail: 10/16/24
Ballots Mailed
- TBD
Ballot Request Deadline
- 10/29/24
Early Vote Date Range
- 10/17/24 – 11/02/24
Toplines
- President Trump received the most Republican votes ever in the state and was the highest vote-getter in 96 out of 100 counties.
- President Trump won 76 counties in 2016 and 75 counties in 2020.
- President Trump’s vote totals increased by 16.8% from 2016 to 2020.
- In 2016, Republicans had a registration advantage in 37 counties, but that has since increased to 57 counties.
Turnout
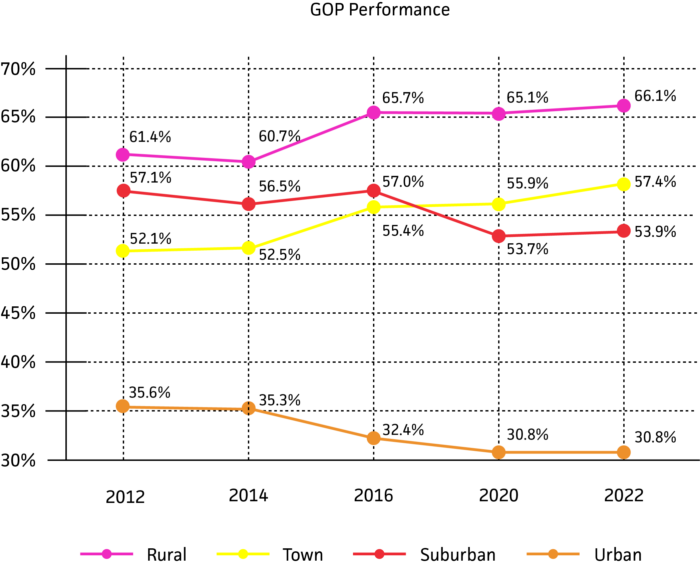
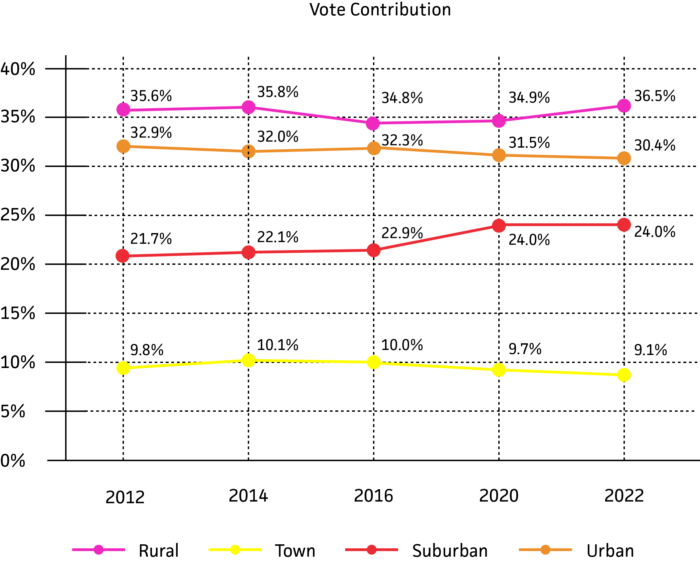
Understanding election results by population density, or metro type as we call it, is crucial because it reveals voting patterns and strategic areas for engagement. Here’s a breakdown of Republican election performances and vote contributions by metro type since 2012:
- Since 2014, Republican performance in rural areas has increased 5.4%, while this region’s contribution to statewide vote has also increased by 0.7%. These trends act as force-multipliers to increase Republican performance in North Carolina.
- Although Republicans have seen a decline in support from urban areas, these areas are also representing less and less of the vote in recent statewide elections.
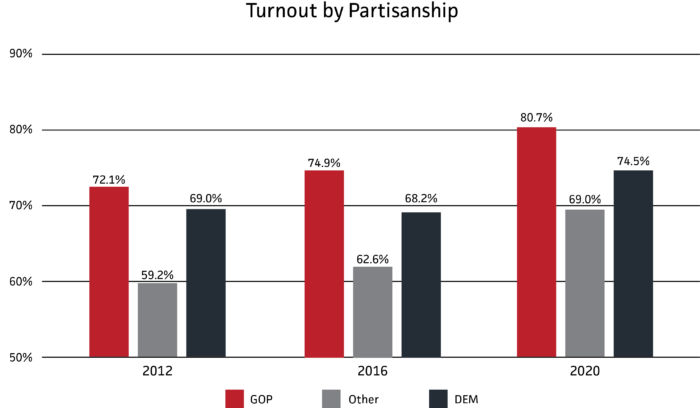
Additionally, the charts below highlight voter turnout trends in presidential elections from 2008 to 2020 and partisan differences between 2012 and 2020.
- Partisan turnout shows registered Republican voters maintaining higher participation compared to registered Democrats.
- While all 3 partisan groups have increased their turnout between 2012 and 2020, unaffiliated & other voters increased by nearly 10 percentage points, which indicates that the unaffiliated voters are becoming more active and more influential in electoral outcomes.

Demographics:
At Data Trust, we collect finalized “close of books” voter files and have a large database going back to 2008 to ensure we can identify and analyze precise trends. Since 2016, there have been some significant changes among demographics in North Carolina.
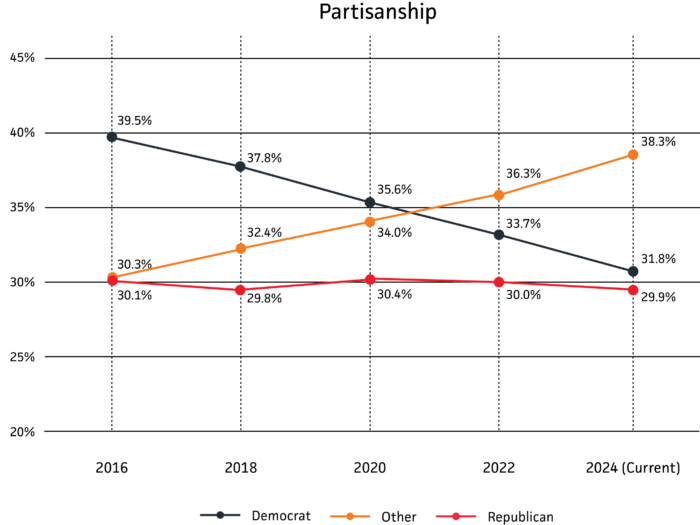
- Over the past 8 years, voters have become less likely to be affiliated with one of the two major parties. Voters who identify as independent, unaffiliated, or with a third party now make up 38.3% of all voters, an 8-point increase from 2016.
- This increase in ‘other’ voters comes nearly entirely from a decrease in Democratic affiliation. While roughly 30% of all registered voters have identified as Republican in each election, Democrats have declined from making up 39.5% of the voter file in 2016 to 31.8% currently.
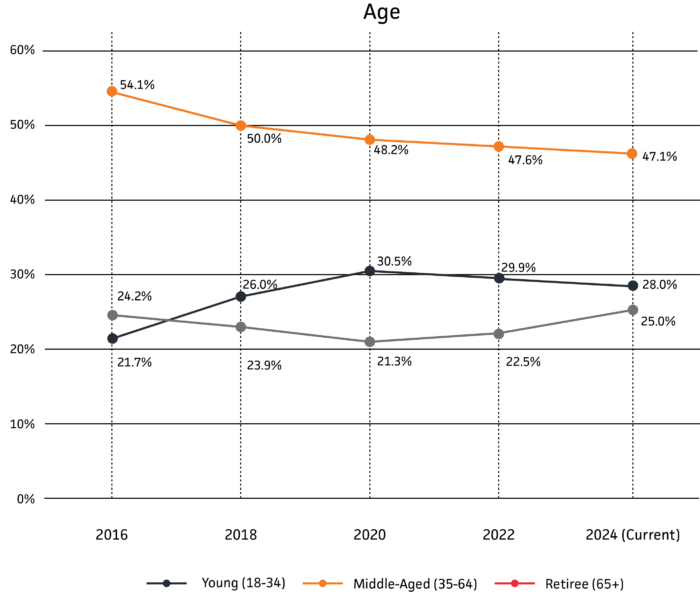
- The electorate as a whole has also been getting younger. Younger voters (under 35) have increased their share of registered voters by 6.3% since 2016 and are now a larger share of the electorate than retirees (age 65+).
- Retirees now make up 0.8% more of the election compared to 2016, while voters 35-64 went from representing a clear majority of all registered voters in 2016 to 47.1% currently.
AB/EV
Data Trust collects the AB/EV file from the North Carolina State Board of Elections daily, allowing for immediate insights and targeting of individual voters.
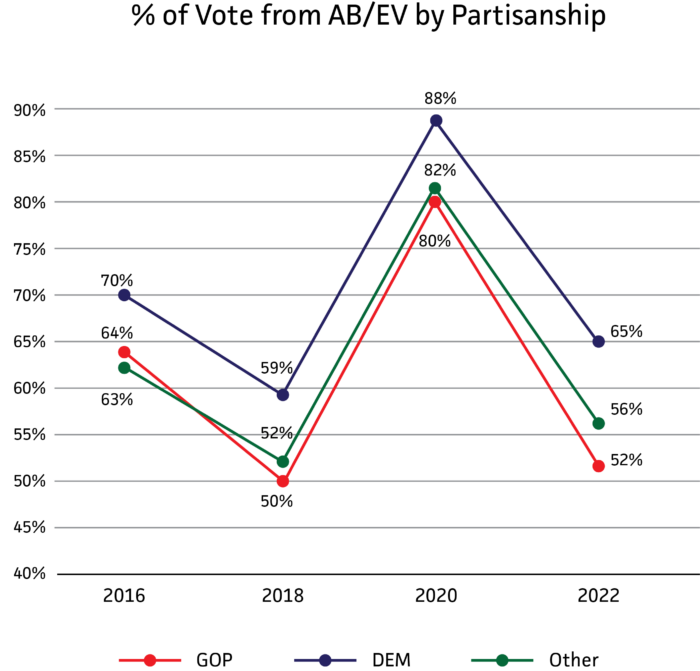
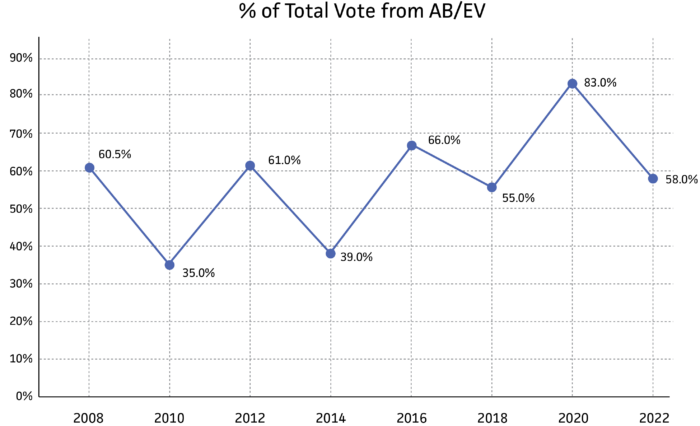
- Absentee ballots and early voting (AB/EV) saw a significant increase in 2020, peaking at 83.0%, but this increase didn’t carry over into 2022, as there was only a slight uptick in ABEV voting compared to 2018.
- Starting in 2016, there was a clear effort to increase the ABEV voting share, with a 5-point increase compared to the 2012 Presidential election. This trend continued in 2018, marking the first time that a majority of voters in a midterm election cast their ballot before election day – jumping from 39% of votes in the 2014 Midterm election up to 55% in the 2018 November election, a trend that largely held post-pandemic in 2022.
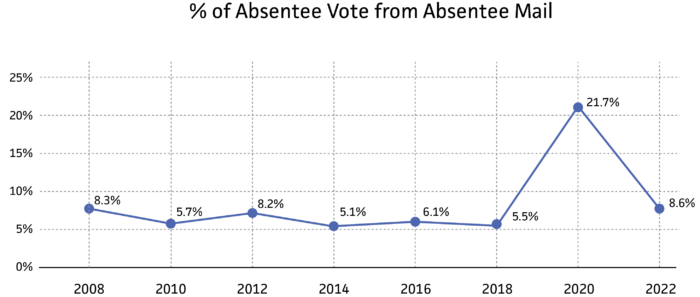
- In North Carolina, Absentee By-Mail is still quite limited (outside of the pandemic spike in 2020), as the vast majority of AB/EV ballots are from those who vote early in-person. Other than the 2020 election, no election has had even 9% of their total Absentee ballots cast be from mail.
- Even though Republican voters prefer to vote on election day, consistently over 50% of their voters turn out to vote by AB/EV methods pre-election day.
