Electoral Votes: 15
Important Dates
These dates are subject to change, please confer with your local electoral authority as Election Day approaches.
Registration Deadlines
- 10/21/24
- Has same-day voter registration
Ballots Mailed
- 9/21/24
Ballot Request Deadline
- 11/01/24
Early Vote Date Range
- 09/26/24 – 11/04/24
Toplines
- In 2020, President Trump received the highest number of Republican votes ever, having the highest vote totals in 58 out of Michigan’s 83 counties.
- President Trump’s vote totals increased by 16.2%, or 370k votes, from 2016 to 2020.
- In the 30 fast-growing Michigan counties, relative to their respective vote totals, President Trump won 28 of the counties. These 30 counties account for almost half of the vote total increase from 2012 to 2020.
- Rural areas have seen the largest increase in support for Republicans, increasing by 7.4% from 2012 to 2020. These areas account for nearly one-third of the vote statewide.

Turnout
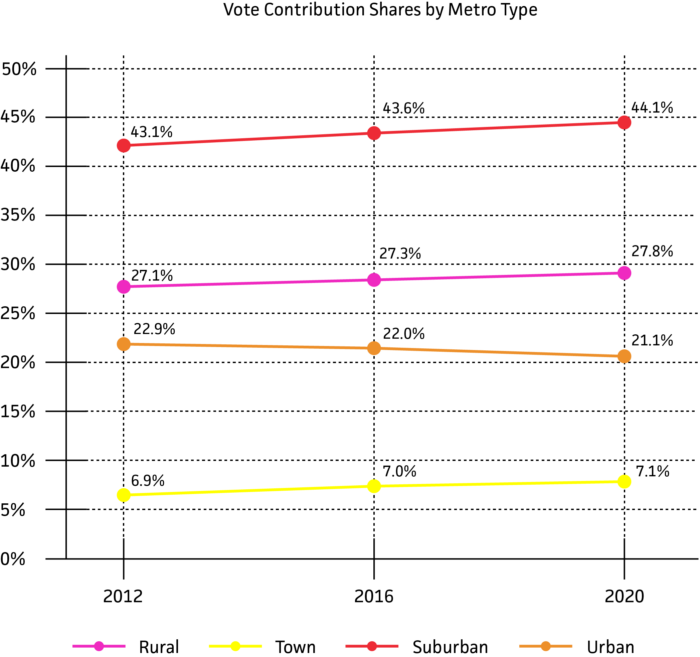
Understanding election results by population density, or metro type as we call it, is crucial because it reveals voting patterns and strategic areas for engagement. Here’s a breakdown of Republican election performances and vote contributions in Presidential years by metro type since 2012:
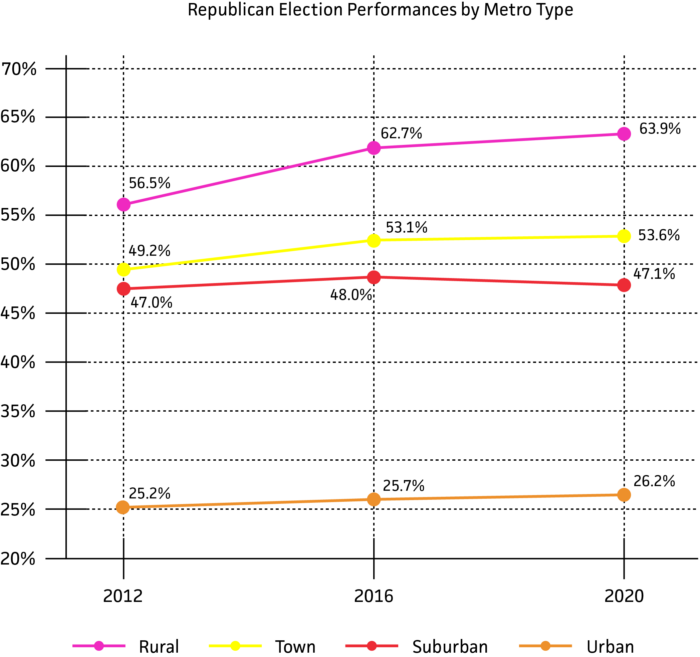
- From 2012 to 2020, Republican performances in Michigan in rural and town areas had the largest increases.
- Suburban areas were the largest growing metro types while urban areas have been consistently contributing less to the total vote in Michigan.d
AB/EV
Data Trust collects and standardizes the AB/EV files from the Michigan Secretary of State daily. This allows for immediate insights and targeting of these voters. The chart below highlights the percentage of votes coming from absentee votes.
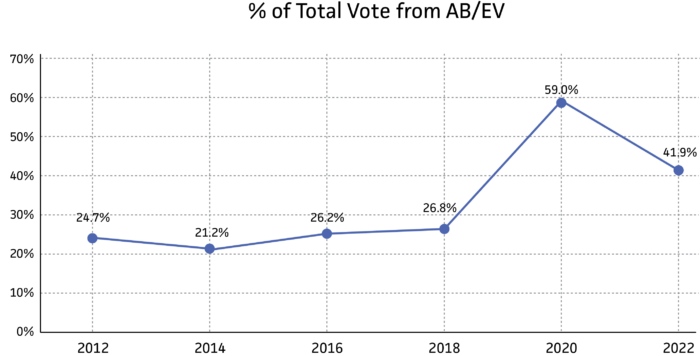
- AB/EV voting increased by 158% from 2016 to 2020 and by 62% from 2018 to 2022.
- The pandemic clearly shifted the voting methods used by Michigan voters, and it does not seem like voters will completely fall back to their pre-pandemic voting patterns here.
There is more nuance to these voting patterns changes, which can be seen in the final chart below of the percentage of absentee votes broken out by modeled partisanship.
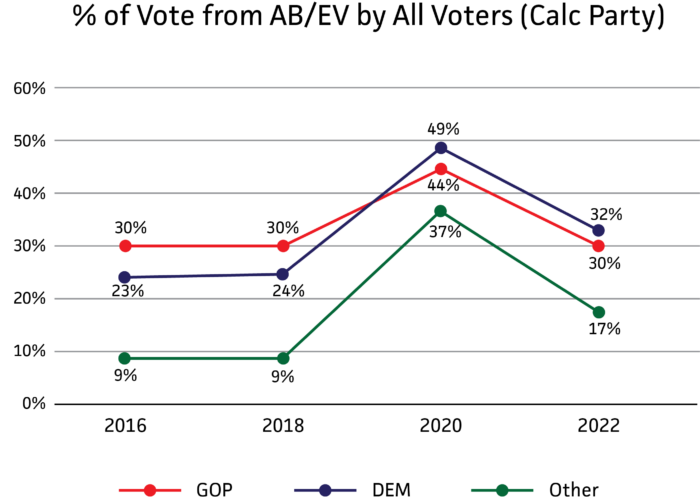
- Modeled Republicans took advantage of AB/EV voting in greater numbers than other voters prior to the pandemic, but since then modeled Democrats have further embraced this voting method while Republicans have retreated to their previous voting patterns.
- After a pandemic year surge in absentee voting, modeled unaffiliated voters still nearly doubled their usage of absentee voting compared to their pre-pandemic trend.
Michigan voters have clearly shown new voting patterns in recent elections, and so it is more important than ever that you leverage Data Trust current and historical data to properly target voters.