Electoral Votes: 11
Important Dates
These dates are subject to change, please confer with your local electoral authority as Election Day approaches.
Registration Deadlines
- 10/07/24
Ballots Mailed
- 10/09/2024
Ballot Request Deadline
- 10/25/24
Early Vote Date Range
- 10/09/24 – 11/01/24
Toplines
- In 2020, President Trump received the highest number of votes ever for a Republican candidate and had the most votes ever for a Republican in 14 out of Arizona’s 15 counties.
- President Trump’s vote totals increased by 32.7% from 2016 to 2020.
- President Trump’s margin of victory grew in 11 out of Arizona’s 15 counties.
- In Arizona’s 5 fastest growing counties, President Trump won and improved his margin of victory in 4 of these 5 counties.

Turnout
From 2012 to 2022, Republican performances in Arizona have been relatively stable in rural and town areas. In contrast, there is a notable decline in suburban and urban vote share over the same period, with urban areas showing the steepest drop from 50.5% in 2012 to 43.6% in 2020.This is crucial because suburban and urban areas account for ~80% of the vote in the state.
-
- The charts below highlight voter turnout trends in recent presidential elections.
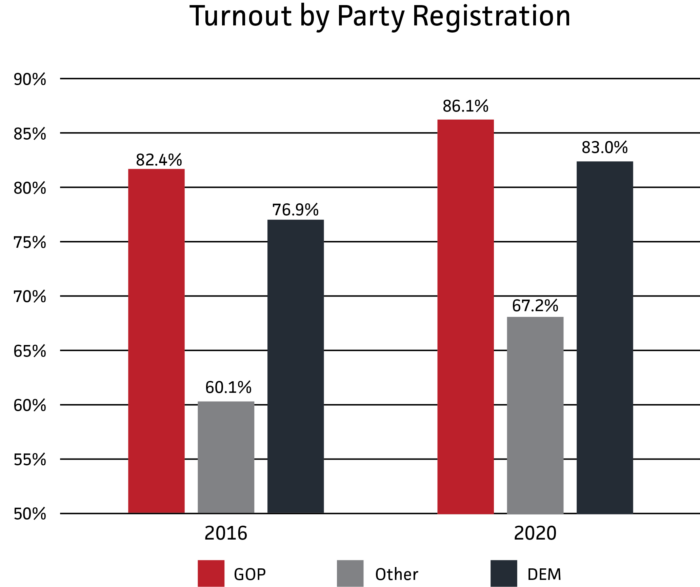
- Turnout among active voters dipped to 71.5% in 2016 but rebounded to 78.6% in 2020.
- Partisan turnout shows Republican voters consistently turnout the largest share of their base, increasing by 3.7% from 2016 to 2020, while Democrat turnout rebounded even stronger by 6.1% in 2020.
-
- Unaffiliated and other party registrant voters had the largest increase at 7.1%, highlighting their growing influence on election outcomes.
- The charts below highlight voter turnout trends in recent presidential elections.
AB/EV
Data Trust collects and standardizes the AB/EV file individually from each county, including daily from Maricopa and Pima counties. Due to this county-level collection, Arizona is one of the hardest states to collect AB/EV records; by leveraging Data Trust data our clients can immediately glean insights and target of these voters.
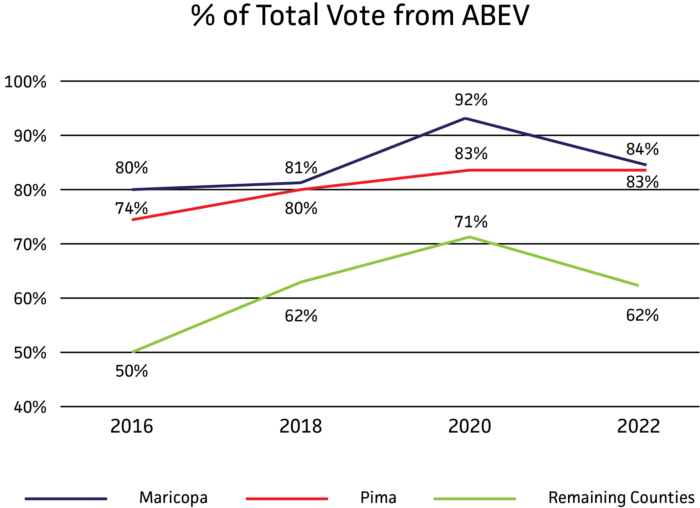
All areas in Arizona saw a pandemic peak in absentee voting in 2020, despite already having widespread usage of these voting methods throughout the state.
-
- By 2022, AB/EV participation slightly decreased but remained above pre-pandemic trends in Arizona’s two largest counties, with Maricopa at 84%, Pima steady at 83%.
- Meanwhile, the remaining counties fell back to match their midterm election AB/EV turnout at 62%.
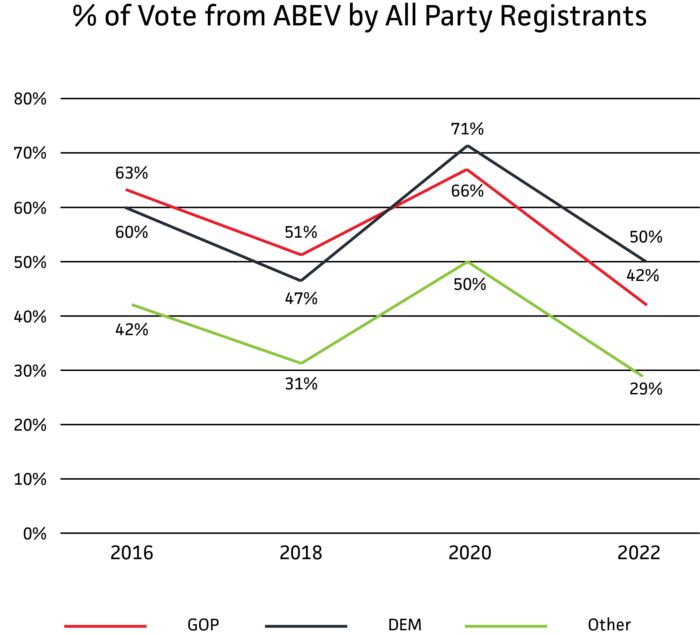
The final chart shows the percentage of votes from AB/EV by partisanship over the same time period.
-
- From 2016 to 2020, Democrats increased their percentage of AB/EV voting compared to Republican and other party registrants.