At Data Trust, we know our clients request Vote History files as soon as they become available, which is why it is such a high priority for our entire team. The Louisiana Vote History file has recently become available from the state, an election which saw Republican Jeff Landry take back the Governorship, giving Louisiana Republicans their second state legislative body trifecta since 1873 (last held from 2011 to 2015).
Our best-in-class data collection and processing team allows Data Trust to quickly turn around key insights and analyses from these recent elections to share with our partners. The data clearly shows that by lowering the voter registration gap, Republicans have put themselves in a much stronger position for electoral success by running strong turnout operations. Data Trust is proud to work with clients and partners who utilize our data to make transformative changes in their states, as evidenced in Louisiana over the past decade.
Below are some key highlights the Data Trust team saw based on this incoming Vote History file:
- Republicans have done a fantastic job at closing the voter registration gap by over half a million voters since 2011.
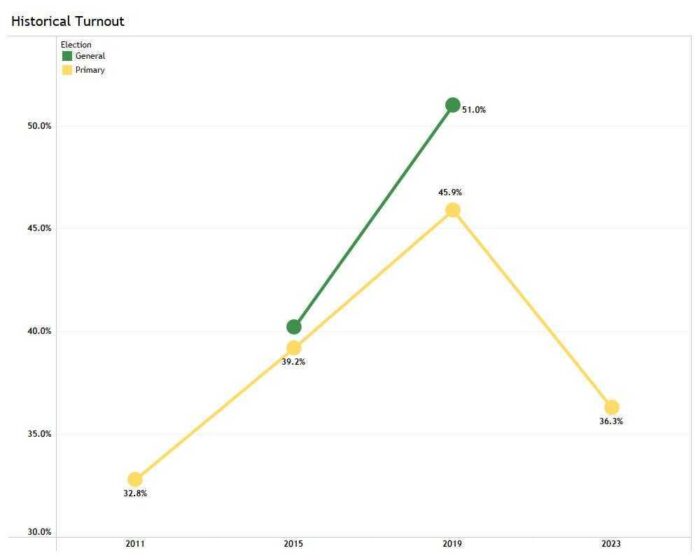
- Democrat enthusiasm was at an all-time low in 2023 (36% turnout for registered Democrats) while Republican turnout (46%) was higher than it was in the 2011 and 2015 primary and general elections.
- When looking at the electorate that voted in the 2023 primary compared to the share of all voter, we found it was:
- 10% more Republican (44% of 2023 primary voters vs. 34% of all registered voters)
- Democrats had the same share (39% vs. 39%)
- Significantly older (60% vs. 40%)
- Most of this imbalance came from the youth vote (11% vs. 27%)
- Skewed Whiter (60% vs. 49%)
- 10% more Republican (44% of 2023 primary voters vs. 34% of all registered voters)
- Like much of the rest of the country, Louisiana Republican performances in smaller and rural parishes are hitting historic highs in terms of contribution to the total vote and in terms of Republican performances. This led to Republicans winning 94% of the parishes, even topping former Governor Jindal’s historic performance in 2011 by one parish.
- Republicans had more votes than Democrats in 60/64 parishes (These 60 parishes totaled 83% of the total vote in 2023)
Read on for more details.

Since the 2011 primary election, Republicans and Independent/Other voters are on the rise, while Democrats are rapidly declining. Over this time, Democrats have lost ~260k voters (18% decrease), Republicans have added ~250k voters (24% increase), and other voters have added ~145k voters (18% increase). If this rate continues, Republicans should expect to pass Democrats in party registration by the 2027 Gubernatorial election.


2023 Turnout Review
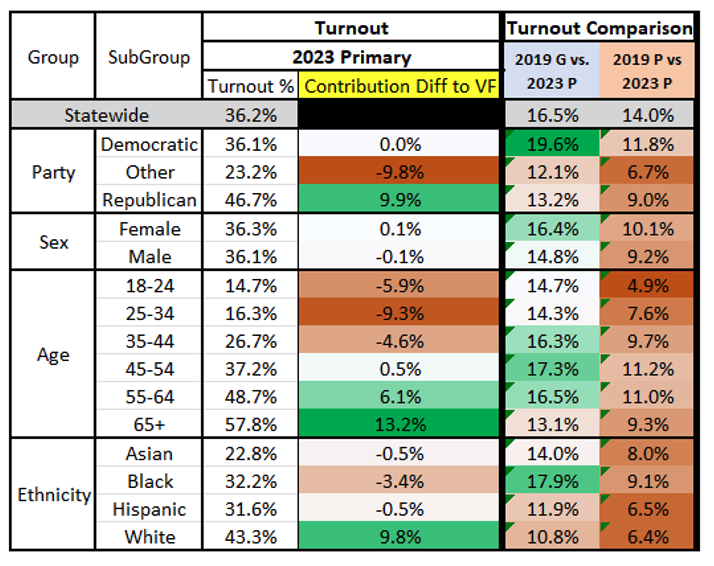
Overall turnout for the primary elections was 36.2%, the lowest since the 2011 primary election. Compared to statewide turnout, Republicans had a higher turnout at 46.9%. Democrats had the lowest turnout out of any of the last four gubernatorial elections at 36.3%. Independent/Others had a low turnout at 23.2%. Republicans made up 43.8% of the vote in the 2023 primary, which is a ten-point higher percentage than Republicans on the Voter File (33.8%).

The left-side of the Demographic data table shows the 2023 primary turnout as well as each subgroup’s comparison between their contribution to the total vote and their share of voters on the Voter File (VF). The right-side compares the turnout rates between the 2019 general and primary elections. The green shading indicates subgroup segments that had a much higher turnout in the 2019 elections compared to 2023. This clearly demonstrates there are two different sets of electorates for the primary and general elections.

Examining media markets in Louisiana, the left table shows the media market’s contribution to the overall vote in the state in each recent election, while the right table shows the Republican percentage of the total vote.
- Smaller and more Republican media markets contribute more to the statewide result compared to general elections.
- Democratic election performances improve in every single media market during general elections compared to primary elections. The trend that Republicans clearly have an advantage during primary elections compared to general elections is really emphasized by this table and the next table as well.

This final table highlights the difference in demographics of the voters who voted in the 2019 general election compared to the voters who didn’t vote in the 2019 October primary. The red shading indicates those demographic sub-groups that are more representative of the electorate in general elections compared to primary elections. The demographic subgroups that are more likely to turn out during the general elections compared to the primary elections are voters who are younger, more female, less white, and are more representative of Democrats/other party affiliations.

This final map shows the turnout by parish for this recent October primary election. Parishes around Baton Rouge had the largest impact on the race as these nontraditional Republican areas supported Republicans with 61.3% of the vote in the 2023 October primary. For reference, in the 2019 and 2015 general elections, the Baton Rouge DMA had Republican vote percentages of 43.2% and 38.1%, respectively.
It is crucial that clients understand how recent turnout is affecting election trends throughout the country to make better and faster decisions. As the leading provider of Voter File collection and processing, Data Trust can assist your organization in making informed decisions regarding voter behavior and recent election trends. If you would like to learn more about how Data Trust can support your projects and data requirements, please contact us here.